
Any plummeting soon?

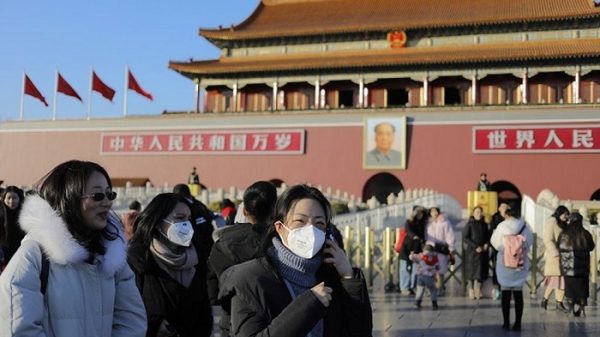
THE United States was experiencing a fall of COVID-19 in the middle of May. But then the cases started to rise and stay at a level almost close to the cases observed in the first wave. Was it due to the lackadaisical adoption of the control measures or a new virus variant that wreaked havoc — for example, D614G? Iran is also going through a similar experience. Among countries reporting their cases by late January, besides the United States, India, the Philippines and Russia still show either a surging number of cases or no sign of a clear-cut fall as yet.
Among countries which reported their first case(s) in February or March, a few except countries such as New Zealand have shown a fall in their cases by now. In fact, South Africa and Mexico are still rising to their peak. Brazil is experiencing ups and downs at regular intervals. Saudi Arabia is also showing a visible fall. Pakistan is showing a fall of its cases, probably, too.
Peru reported its first case quite late in comparison with most other countries on March 7, which is close to that of Bangladesh. Cases are falling in Peru, but still with a high number of cases — 2,511 on June 24. It has a population of 32 millions, in a landmass of 1.3 square kilometres much lower in population density compared with Bangladesh — understandably with a better scope to maintain physical distancing. So, the fall that Peru has attained may not apply to Bangladesh.
Countries that have nominal number of cases now (no country has shown zero number of cases holding for long yet) show a good fit into a normal curve, when the number of their cases is graphed (population characteristics and events usually exhibit a hanging bell shaped curve when graphed, called the ‘normal curve’). The mean of the counts or measures, which means the highest number of counts, are found at the middle of the curve, while the least and the highest number of counts lie on the left and the right-hand sides of the curve respectively. This means that the least and the highest number of cases are always fewer in a normally distributed event. It may be assumed that the countries that have not shown any discernible fall yet will ultimately assume a normal curve, albeit after running a longer course. A look at a graph, based on the number of infections, therefore, may help to expect when infectious cases might fall.
Three other distinct patterns of the COVID-19 infection are noticeable. Some countries show a repeat of several, distinct or indistinct, small or relatively big, normal curves. Could it be because of playing fast and loose with the control measures — off again and on again? Sweden is such a country with some distinct and some indistinct normal curves. Singapore is another country with some little similarity. The second is the occurrence of a few cases now and then even after a marked fall of cases for a long period. This is seen in all the countries that show a normal curve, eg European countries, Australia, New Zealand, Turkey, Singapore, South Korea, Japan, etc. The third is that a reduced number of deaths when the infection starts falling. The fall in death is proportionately higher than the number of infection. This might indicate, true to knowledge in epidemiology, that when disease counts start falling, the infectiousness as well as the virulence of the pathogens also start waning, which is but an educated guess.
Predicting future course of disease in Bangladesh
EPIDEMIOLOGICAL models are good exercises, but probably for academic purposes only. These have failed in the past globally. Predictions need valid and adequate information. No country can provide them so easily. For example, how to find out what the percentage of the population is that is inherently immune? How to get accurate information on the proportion of the people who got exposed to SARS-CoV-2? Some other information are relatively easy to find although one cannot vouch for it — people who abide by preventive measures, people who adopted measures to improve their immunity, etc. Past predictions about the number of cases and deaths in Bangladesh have proved inaccurate. Cases have already crossed more than a hundred thousand and deaths probably have also crossed the prediction, if those who died with suggestive clinical features, but could not get themselves tested, are also counted. Instead of decreasing from May 17, cases of COVID-19 started to rise since May 18 and a fall is not within view as yet that was predicted to have happened after May 25.
Viral strain and prediction
EIGHT types/sub-types of SARS-CoV-2 have been circulating globally — variants of types A, B and C. While US scientists have found 11 variants among them, especially in type A, scientists in England found this to be 14. India’s viral genome sequencing shows that it has six variants with homogeneity to those of the United States, Europe, China and Southeast Asia; and Pakistan’s genomic sequencing shows 31 variants, with similarity to those of the United States and China. The number of these phylogenetic variations indicates clearly that not all the variants are deadlier than the parental type or strain.
When the preventive and control measures are applied effectively, the viral types and strains do not carry much weight, however. Differing health outcomes have been noted in Australia and the United States with the same viral type — type A. Reportedly, more than a dozen genomic sequencing have been done in Bangladesh, but we do not know the types and strains of SARS-CoV-2 in the country as yet. So, we cannot say what course and pattern COVID-19 might assume in Bangladesh in the absence of effective containment measures as of now.
The peak in Bangladesh
ONE big question now in Bangladesh is whether Bangladesh has attained its height in the number of COVID-19 cases a day, or it will go up. When will Bangladesh see a fall and what will be the scenario that the fall will take? Can it take double or multiple peaks? Except the United States, at least for the initial fall, no country took more than 13 weeks from the day of the reporting of the first case. Pakistan took 15 weeks before its fall started (to be sure, observation for a few additional days would be warranted). Bangladesh is passing through its 14th week since the first case reported on March 8. A high number of cases have prevailed for the last five weeks. Could it be the big spike before the fall? The graph seems going towards creating a normal curve and if it is true, the cases may fall in probably three more weeks.
A more direct process to assess severity of a disease, vis-à-vis its accentuation and fall, is the basic reproduction rate (R0), which means how many people an infected person transmitted the pathogen (SARS-CoV-2) to. It was estimated to be 2.4 in some countries and 3.0 in some others. R0 has to be less than 1.0 to conclude that the disease magnitude is falling. But this has not been estimated in Bangladesh since a chain follow-up of an index/identified infected person has never been done for contacts and contact of contacts meticulously and virologically. R0 of 3.0 would mean that the index case will transmit the virus to three people and each of the three people will transmit to three more people. This may also be done by testing people randomly of a defined geographical area and testing the same people after one incubation period to find how many people have become infected anew, without any history of external contacts. R0 estimation cannot be done based on the present method of detection of the cases. The number of contacts, on an average, in the present testing method has been shown to be only one, which is unacceptable.

Matching Bangladesh numbers, percentages with WHO indicators
THE World Health Organisation prescribed that a three-week continuous fall of cases may not be a feasible indicator as a sign of falling number of cases. In Iran, a continuous fall started from March 31, from 3,111 cases to 802 on May 2 steadily. After that, the cases started to rise again. In the United States, a fall became noticeable after April 26 until May 19. On April 27, the cases counted 32,417 and on May 2, it was 13,227. In between the fall was not steep though. Another parameter advised by WHO is the test result, which should be less than 5 per cent for at least two weeks. To use it as a good indicator, it is imperative that the same types of people being tested now are tested without any change in this parameter. The inclusion of the people particularly who might give more negative results should be avoided. The other indicator suggested by WHO — the observation that 80 per cent of the infections occur within clusters, cannot be assessed in the present situation as the estimation of infection is not random — not inclusive for all potential individuals for a fair estimation of infection among all types of people. A decrease in the hospital admission rate and in the use of ICUs continuously for two weeks will also indicate the falling of the cases, according to WHO. The reduction in the death rate from pneumonia would be yet another indicator, as WHO says. Unfortunately, the government does not have information on the last indicator accurately.
The falling number of COVID-19 cases, which is a function of its weakening infectiousness and virulence, is accompanied by proportionately much lower number of deaths. This is a sign of a certain fall in the incidence of the disease, which, however, has not been observed as yet in Bangladesh. The problem is that the number of deaths reported in Bangladesh from COVID-19 does not take into account the suspected death as such cases are not tested. So, this information also cannot help in predicting the future course.
Match with peaks of other countries
THE poor, whimsical and haphazard preventive and control practices at individual level in Bangladesh, including a poor adherence to government measures, and the way the samples are collected and tested, not giving a fair scenario of the extent of the infection in the country, do not leave any scope for comparison. We do even not know of the viral types and strains to compare with that in other countries which could provide some clue as to what course a particular virus type and strain might take in Bangladesh under similar socio-cultural and epidemiological conditions. People predicating and projecting the extent and the timeframe now are doing so in the absence of required information. The veracity of their utterances is anybody’s guess.
A look at the peak in different countries shows that the peak stayed on an average from one to three weeks. In Bangladesh, an estimation of the standardised number of cases shows a high counts for the past five weeks with 3,384 standardised cases a day. The test positivity also shows a high rate over the same long period — more than 21.16 per cent. This might be an indicator that the cases might fall after the next couple of weeks, as the numbers do not follow the short periods of rise, remaining at the peak, or falling fast, as in countries that have showed relatively good containment results. However, Bangladesh would probably not show the same scenario as India, South Africa or Mexico either, where cases are still following a clear trend of rise, or Brazil or Peru, with a lot of ups and downs of cases within a short span of time.
The other point to remember is that an apparent fall of the peak may not be an actual fall. There are multitudes of variations even at the falling stages in different countries. It was not unusual to see a second wave of almost equal amplitude at the breaking of the first wave, eg in the United States and Iran. Would Bangladesh exhibit that phenomenon or will it assume a graph similar to that of Europe or Southeast Asia? It is difficult to answer the question now. But it would not be probably like that in Europe or Southeast Asia as control measures in Bangladesh do not match theirs. Probably, the scenario would be in between — a fall with a relatively smaller rise. The graph reveals that there was a slight fall already around the 46th day from the first notification of the disease, followed by the rise that we now see. This probably was due to a large-scale migration around that time. As Bangladesh has a longer peak, double or multiple peaks, as seen in cases of smaller peaks in Sweden, Japan and Singapore, might not happen. But its fall could still be slow with occasional spikes and troughs.
The graph shows the number of cases standardised based on 18,498 tests done on the day of writing this article. This, in fact, shows the day-to-day number of cases that would have appeared if 18,498 tests had been done every day in Bangladesh. This removes the effect of the variations in the daily number of tests done, which influences the magnitude of infections imprecisely, as a function of the number of tests done alone.
AM Zakir Hussain is a former director, Primary Health Care and Disease Control, former director of IEDCR, DGHS, former regional adviser of SEARO, WHO and former staff consultant, Asian Development Bank, Bangladesh.
Share This News


Leave a Reply